Portfolio / Market Analysis App
SharkView
SharkView is a chart analysis app for stocks and cryptocurrencies. Explore market trends, technical indicators, and market rankings to support your own research and investment decisions.


Overview
Understand market trends with technical charts
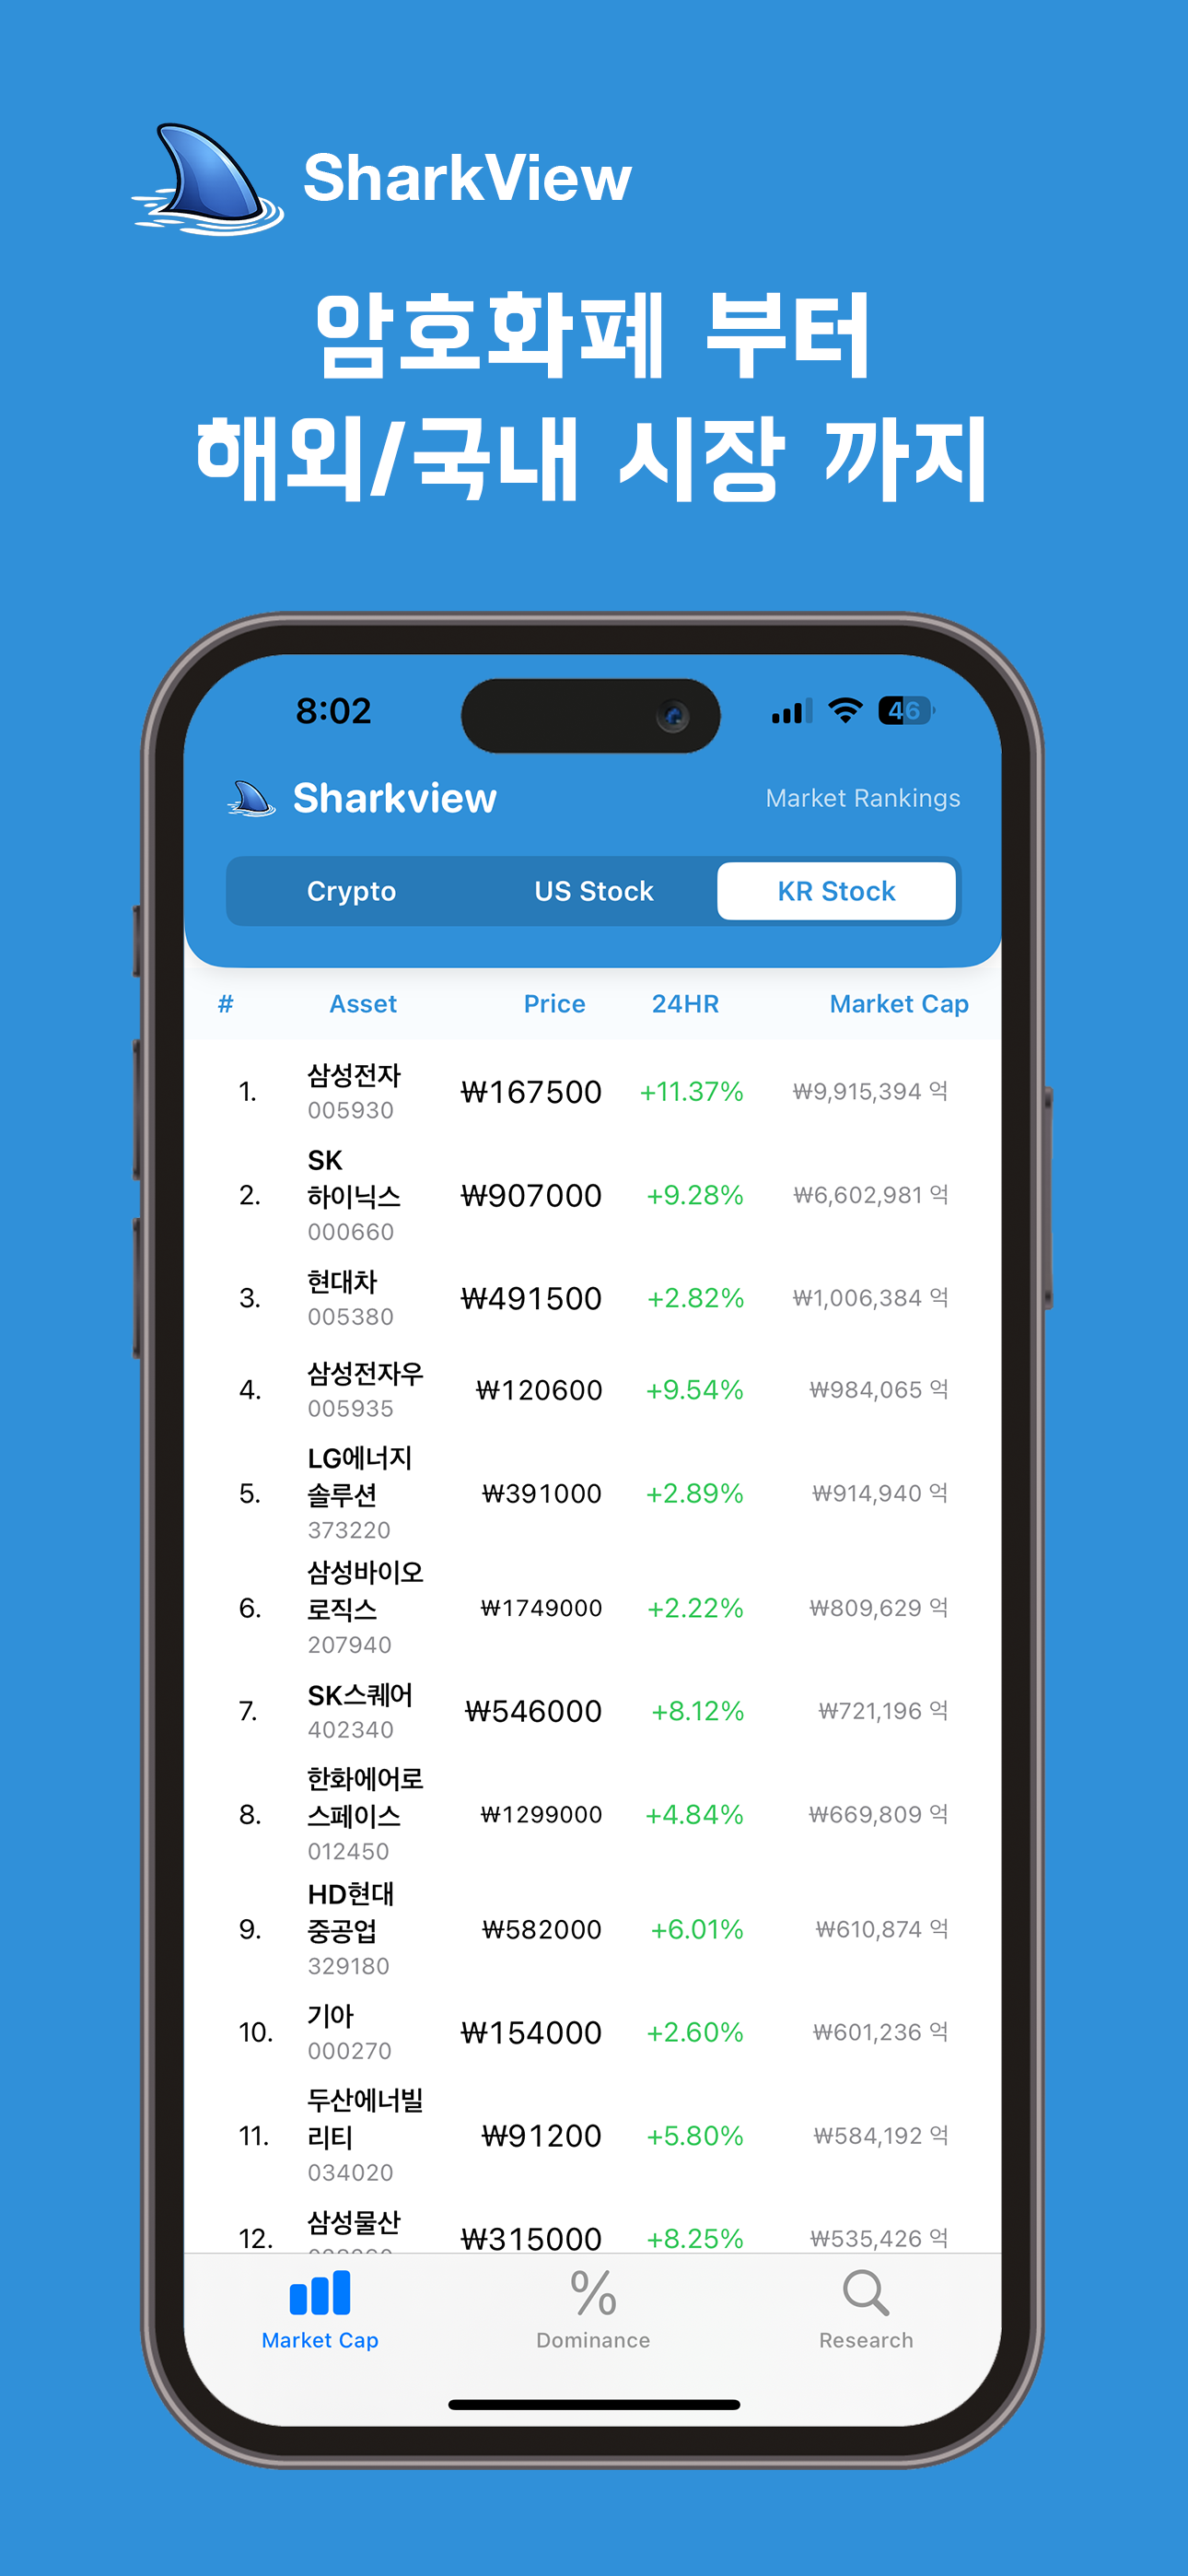
SharkView brings together cryptocurrency, US stock, and Korean stock market data to help you explore price action and identify market trends more efficiently.
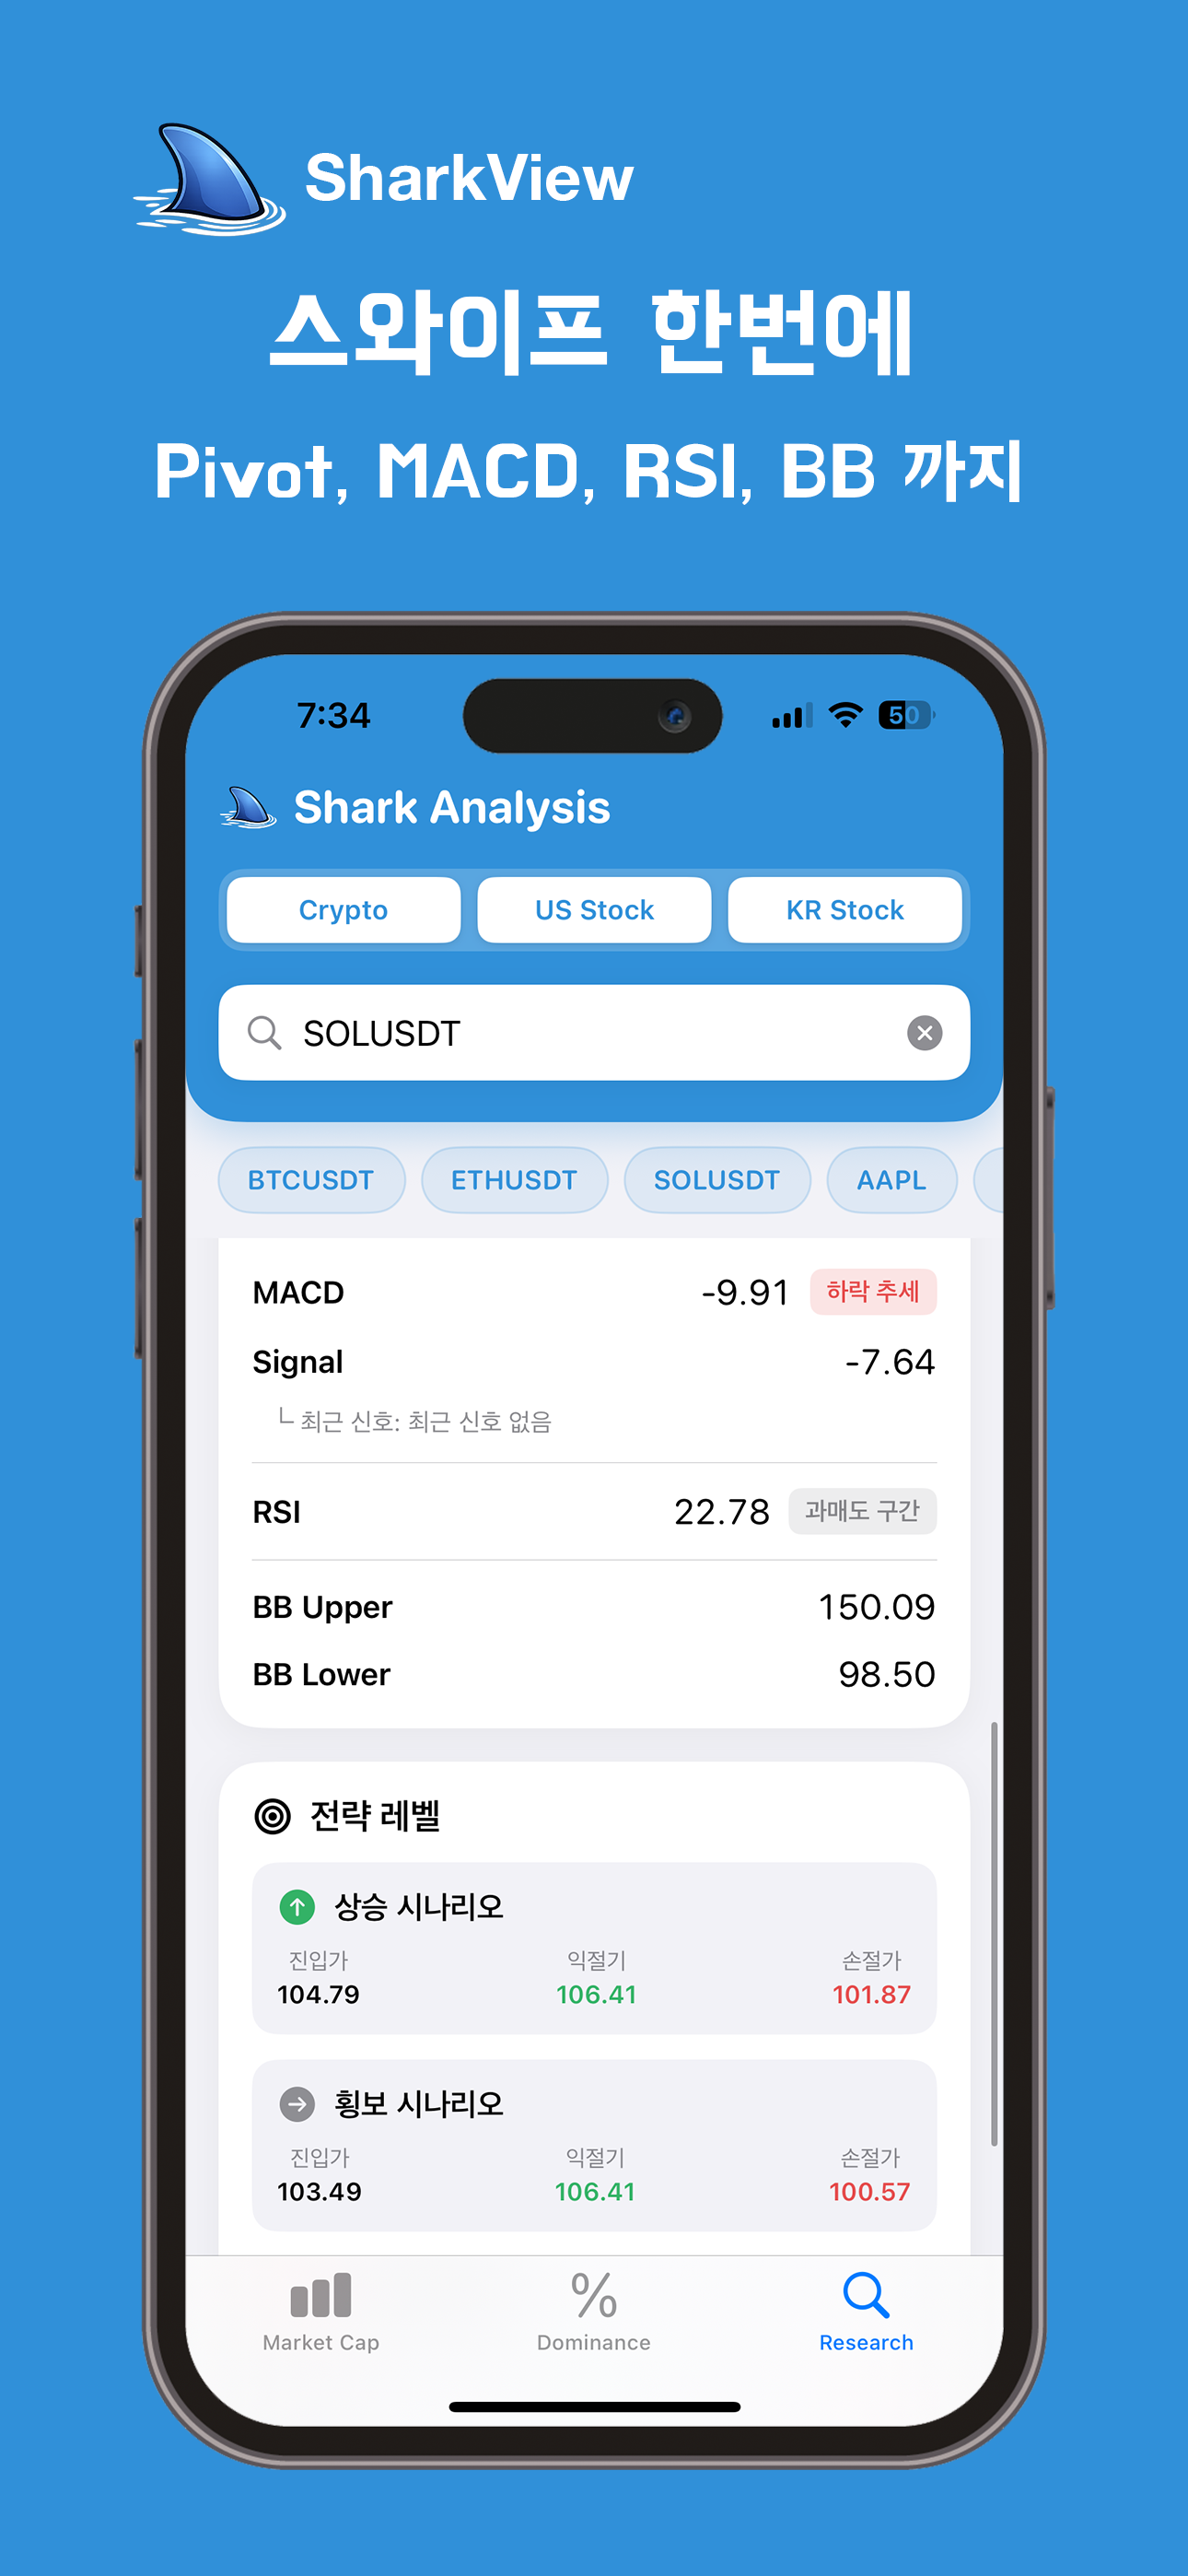
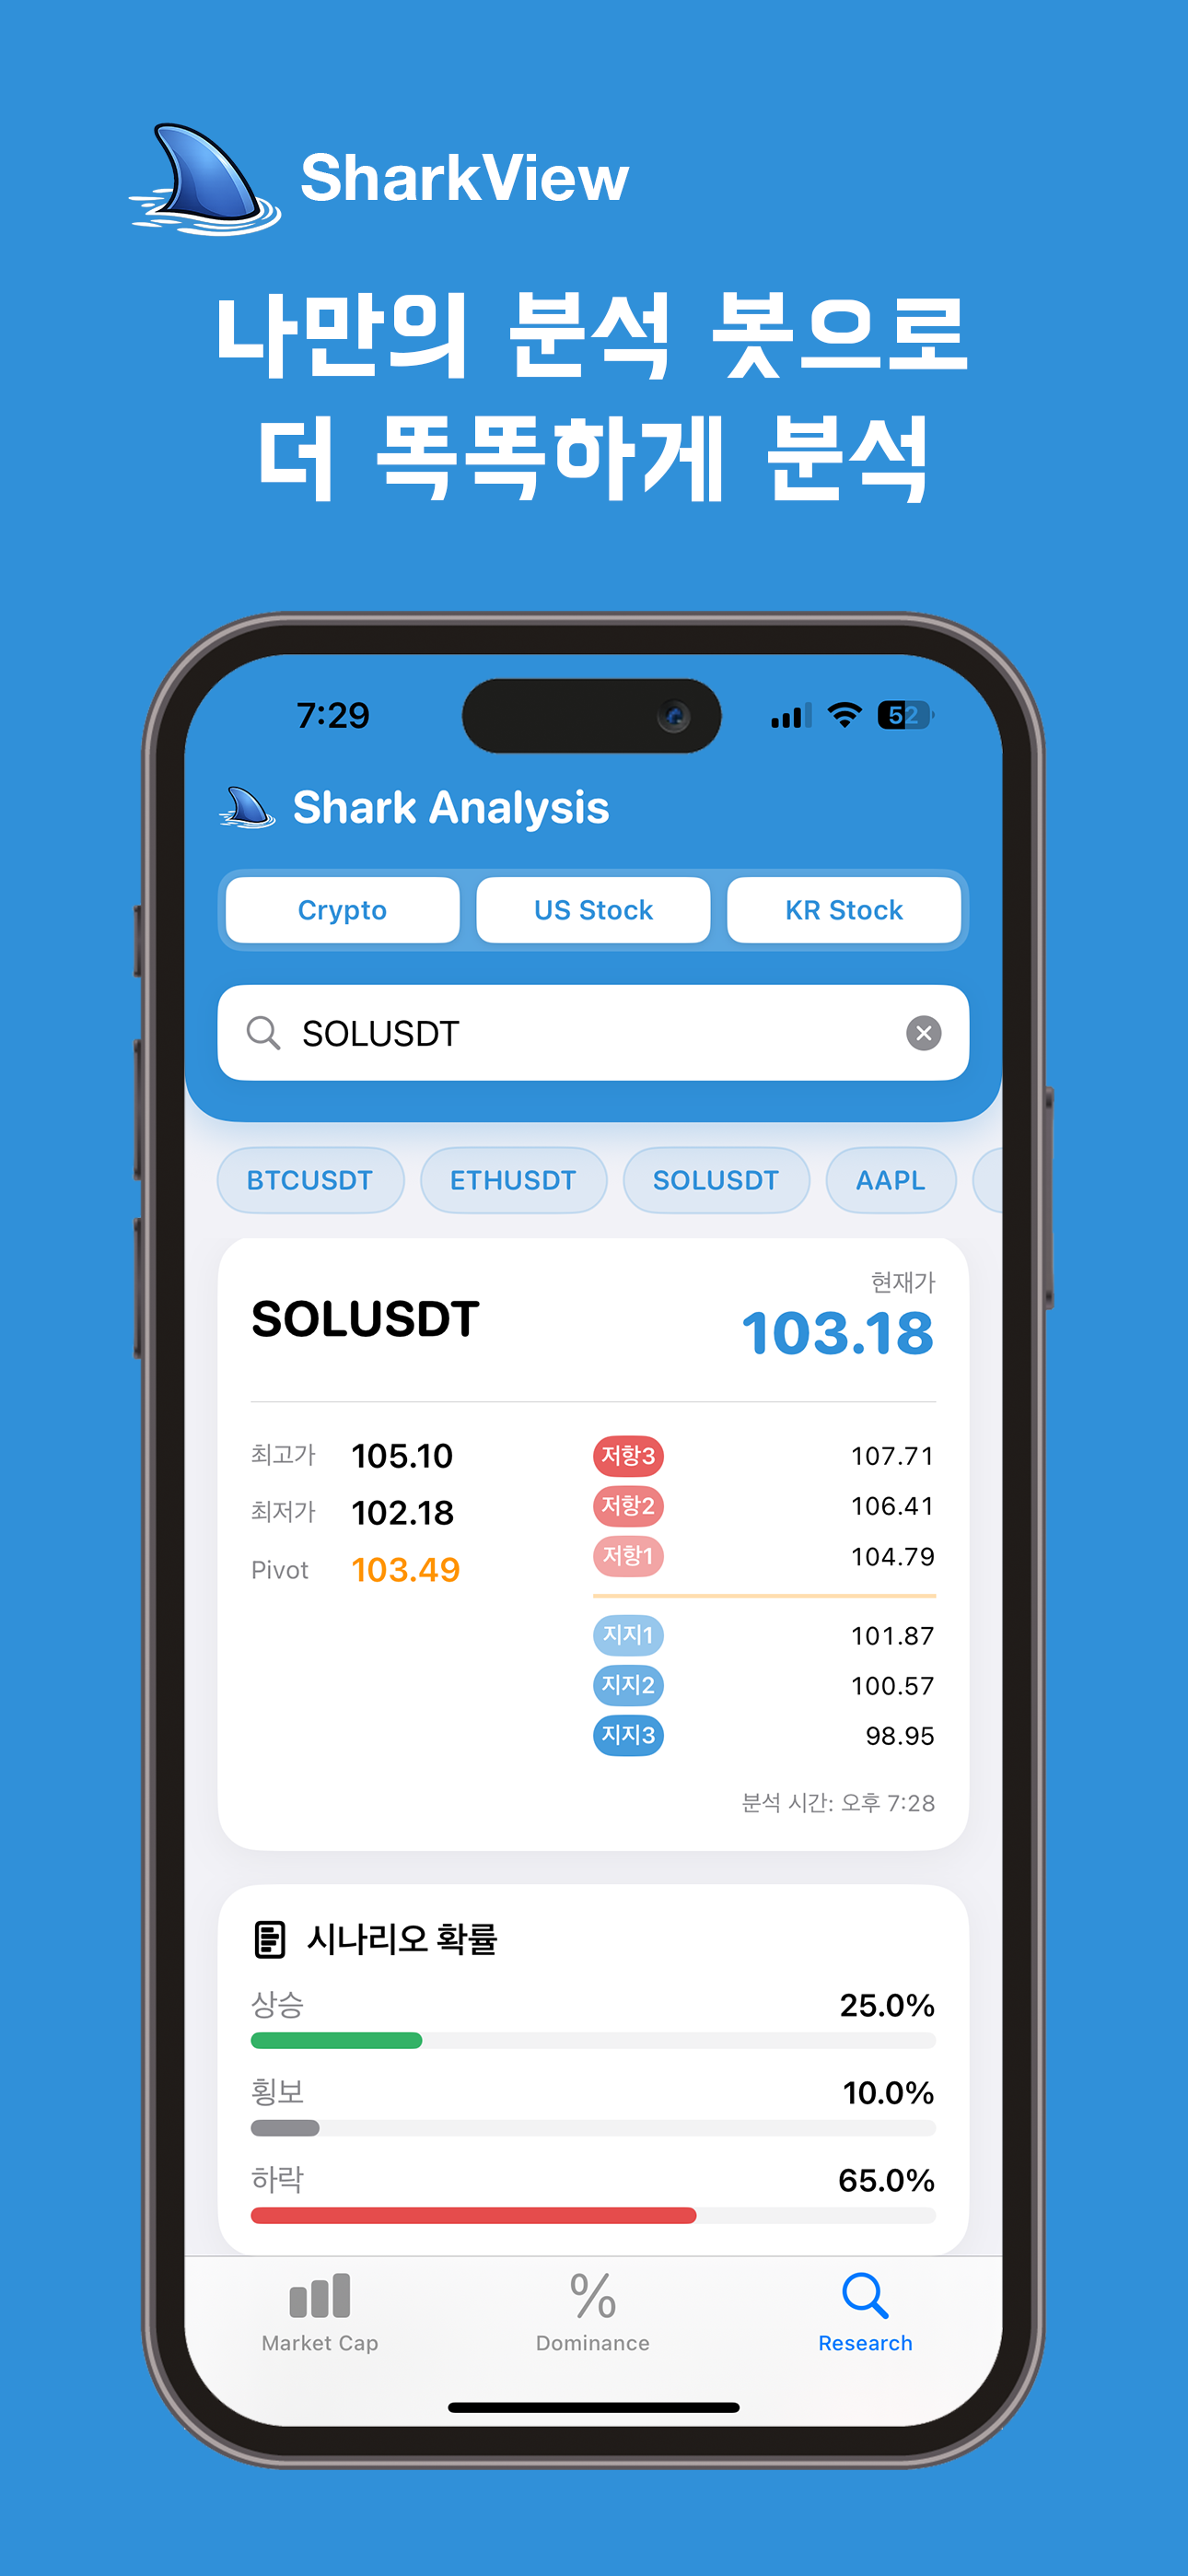
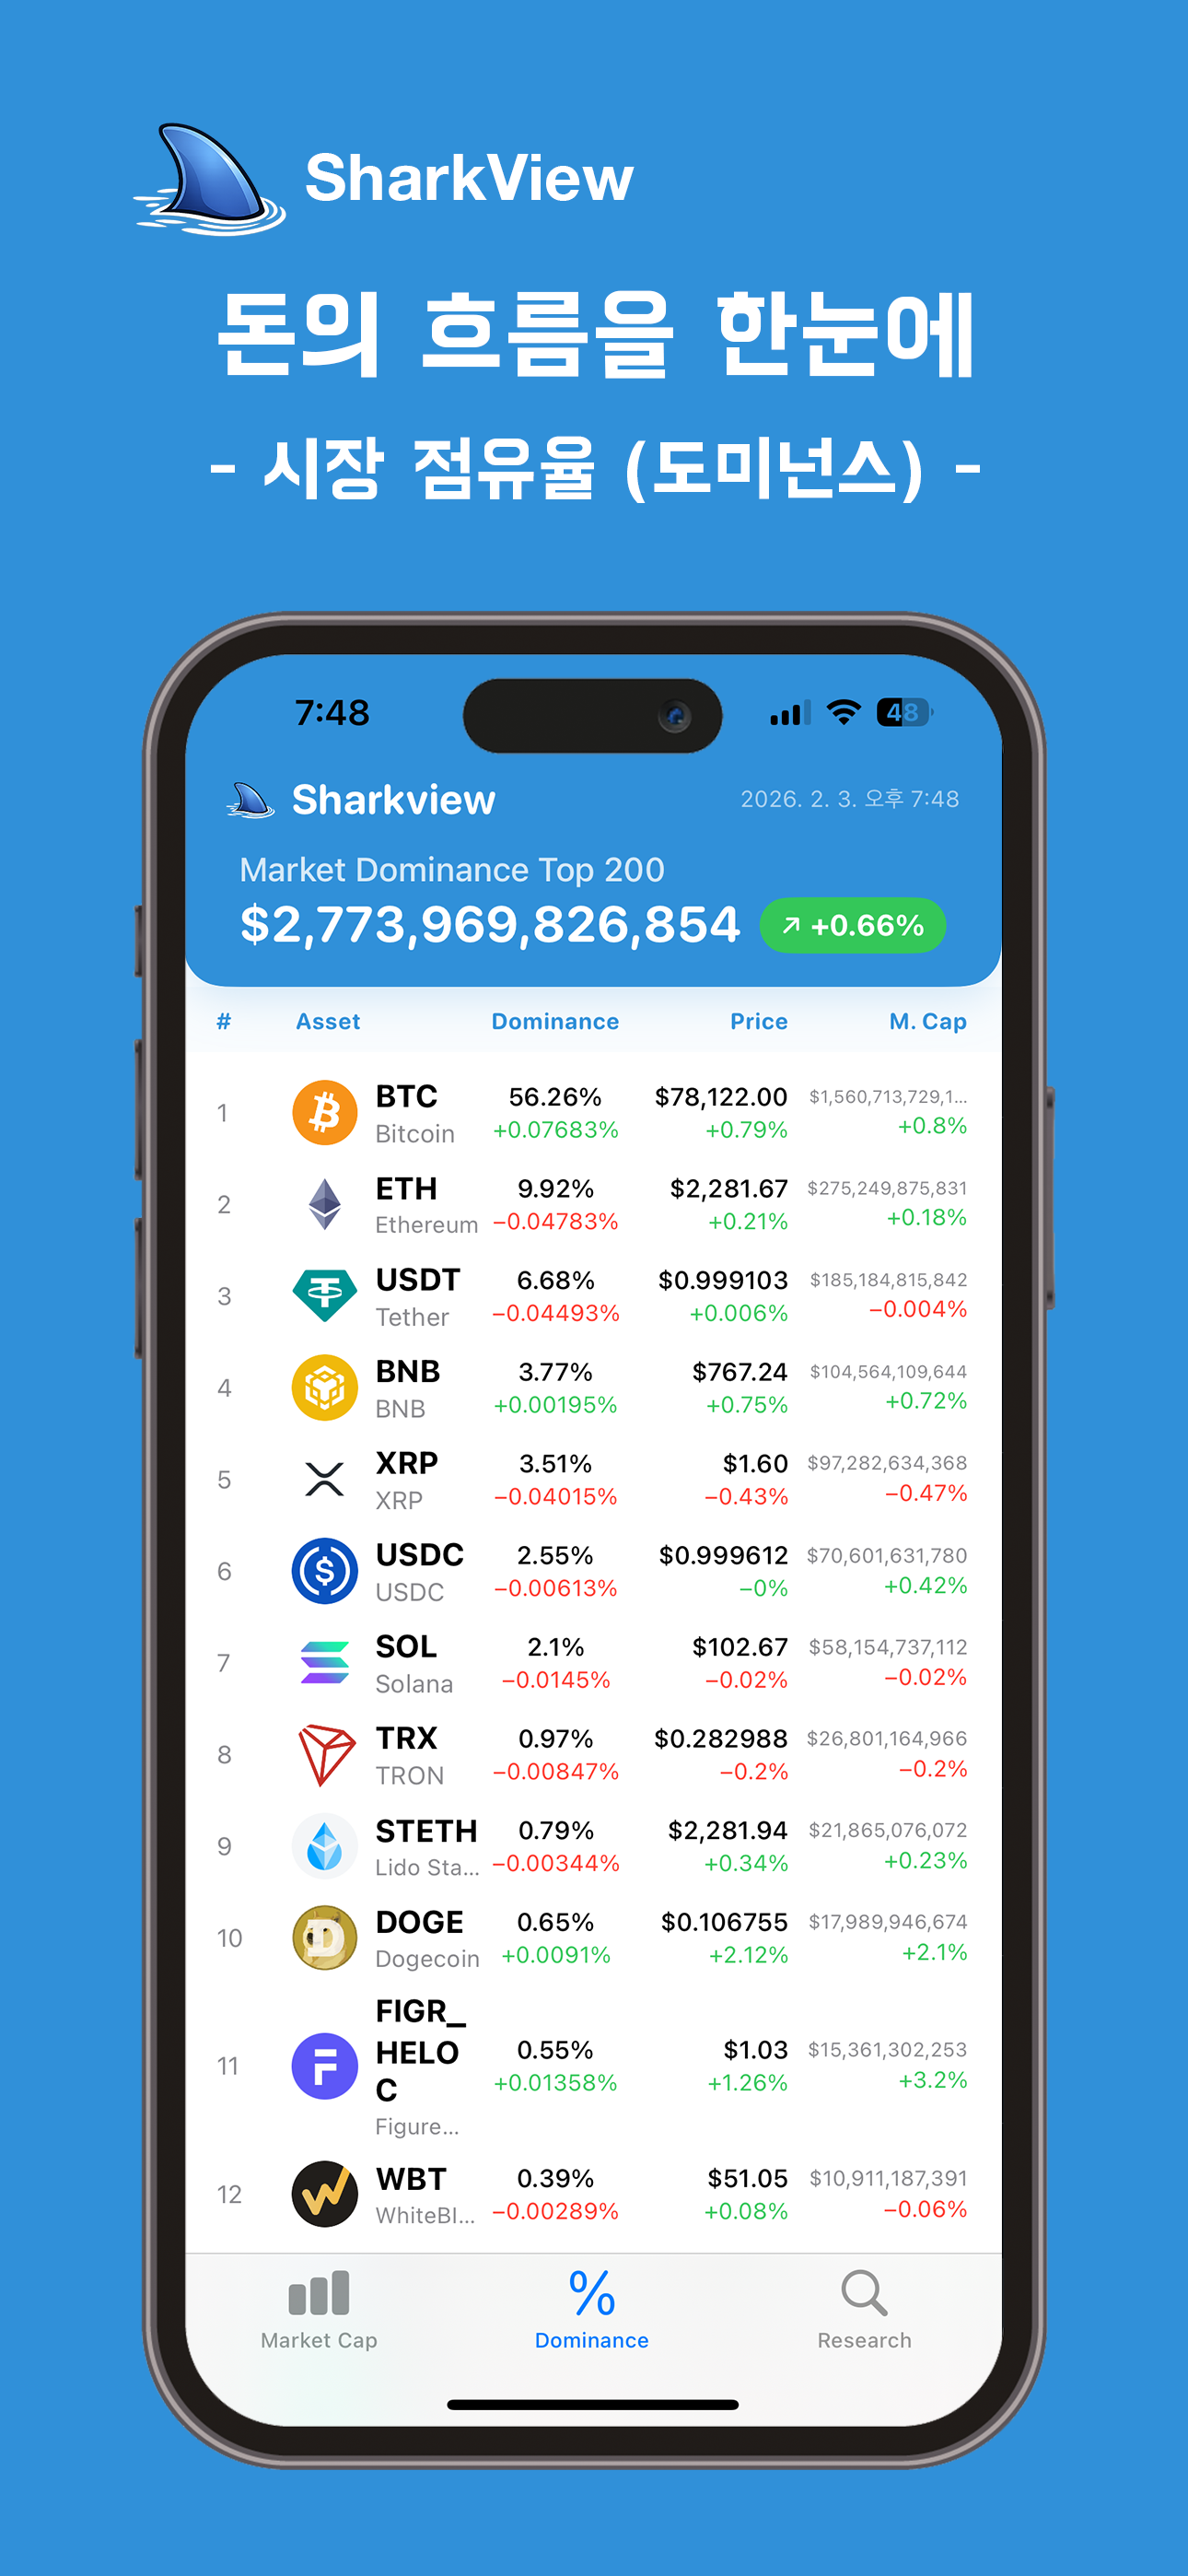
Beyond price quotes, the app presents MACD, RSI, Bollinger Bands, pivot levels, Bitcoin dominance, money flow, and market rankings. These tools help you examine possible entry and risk scenarios; they do not guarantee trading outcomes.
Features
Key Features
Cryptocurrency and stock chart analysis
MACD / RSI / Bollinger Bands
Pivot points and trading scenarios
Market rankings and performance data
Bitcoin dominance and money flow
Entry, stop-loss and take-profit scenarios
Available on App Store and Google Play
AdMob integration
App Preview
SharkView App Screens
Explore technical indicators, pivots, dominance, and market rankings in one place.

Tech Stack
Built With
Mobile AppMarket DataChart AnalysisFirebaseAdMobApp StoreGoogle PlayAI Scenario Logic